Hello I'm
Raj Kapoor@Aung Bo Bo
I'm a Data Science Enthusiast
- robbobroy224@gmail.com
- +91 8847203769
- Mohali Chandigarh, India


As a passionate and capable Computer Science student with a solid foundation in both theoretical concepts and practical applications, I am eager to contribute to innovative projects in a dynamic and collaborative environment. My adaptability, attention to detail, and logical problem-solving abilities, combined with strong collaboration skills will enable me to make meaningful contributions to innovative projects that drive organizational success.
Downlaod CVLooking into a vast amount of business data and analyze them for finding better business insights. And using Python, MySQL, Google BigQuery for analyze the data.
Applied data modeling techniques to design and optimize structured data systems. Proficient in building logical and physical data models to support data integrity and analytical efficiency.
Transformed raw data into meaningful visual stories tailored for end users. Utilized tools like Excel, and Power BI to create interactive dashboards and reports. Enabled data-driven decision-making.
Perform data management and cleansing by ensuring data accuracy, consistency, and reliability. Effectively handled large datasets through systematic cleaning, transformation, and validation processes.


Tools & Technology used - Excel, Google Sheet, Microsoft Suite, Research Tools, Data Cleansing , Data Analysis , Reporting
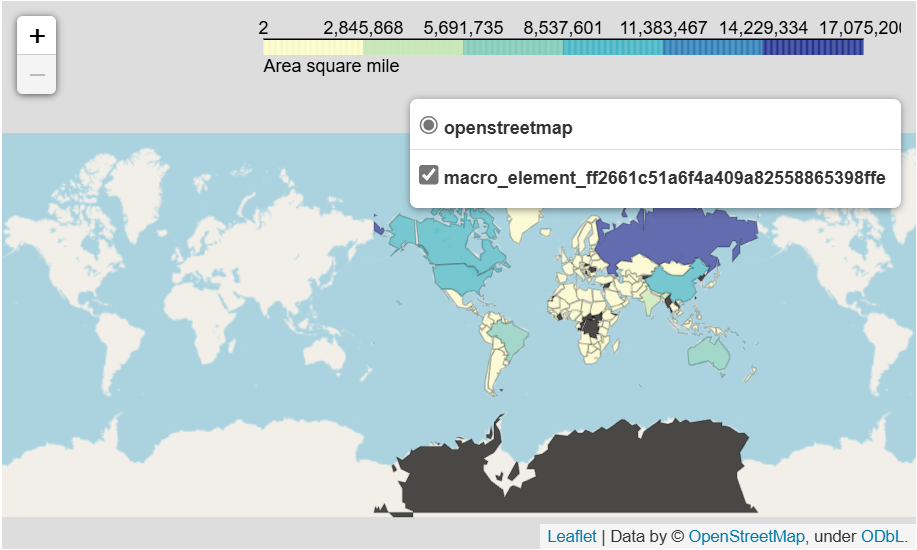
This project, "World Countries Data Analysis", aims to analyze and visualize various socio-economic and demographic indicators across countries to uncover patterns and insights.
Data is gathered from global sources such as the World Bank or United Nations, covering metrics like GDP, population, education, etc.
The dataset is cleaned by handling missing values, correcting inconsistencies, and formatting it for analysis.
Statistical summaries and visualizations are used to explore distributions and relationships among variables.
Charts and graphs are created to display trends and comparisons across countries and regions.
Quantitative techniques are applied to understand and support findings from the data.
Findings are summarized to derive insights that could inform global development strategies or future research.
Tools Likely Used:
Potential Outcomes Include:
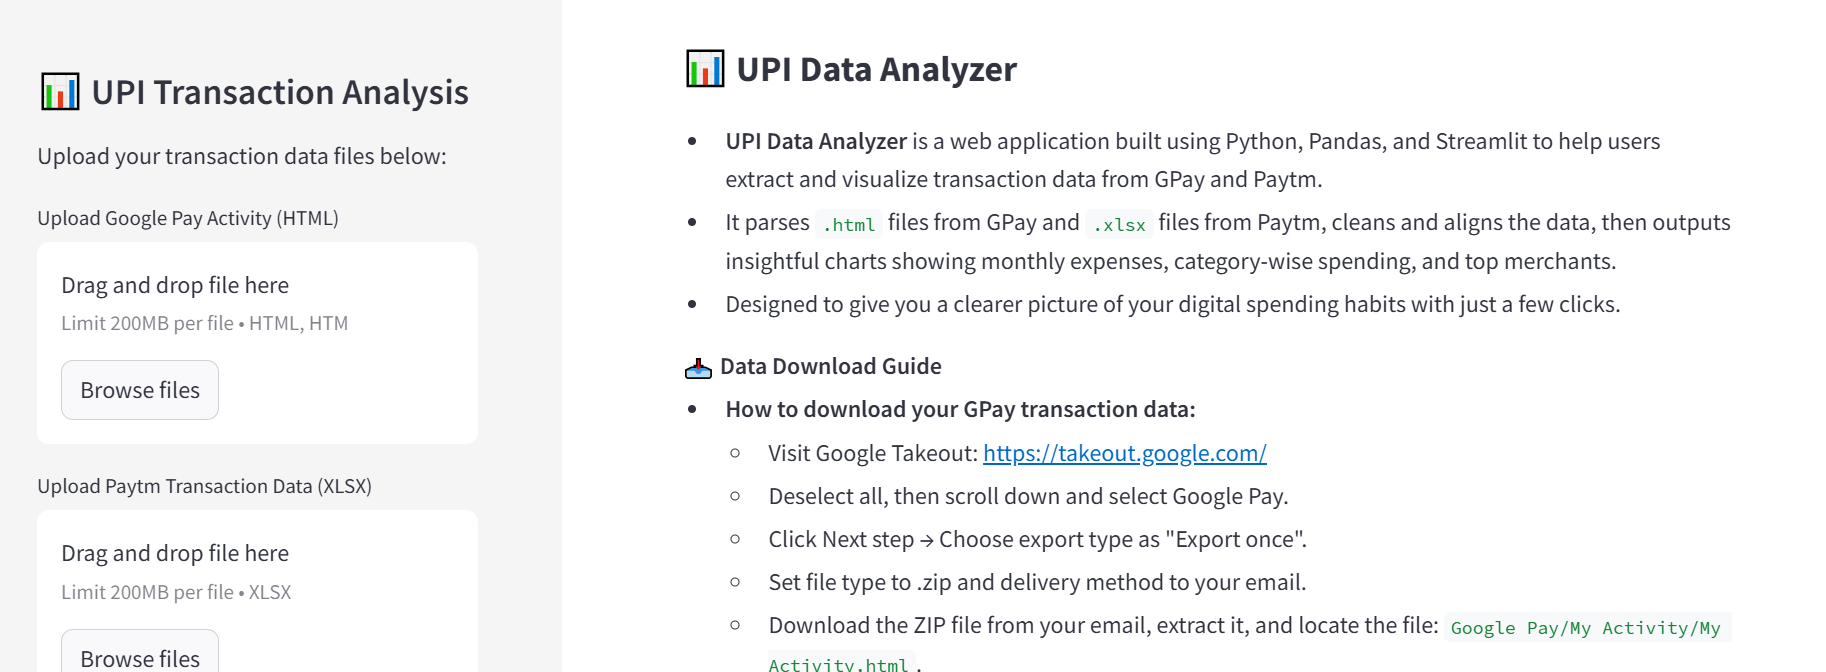
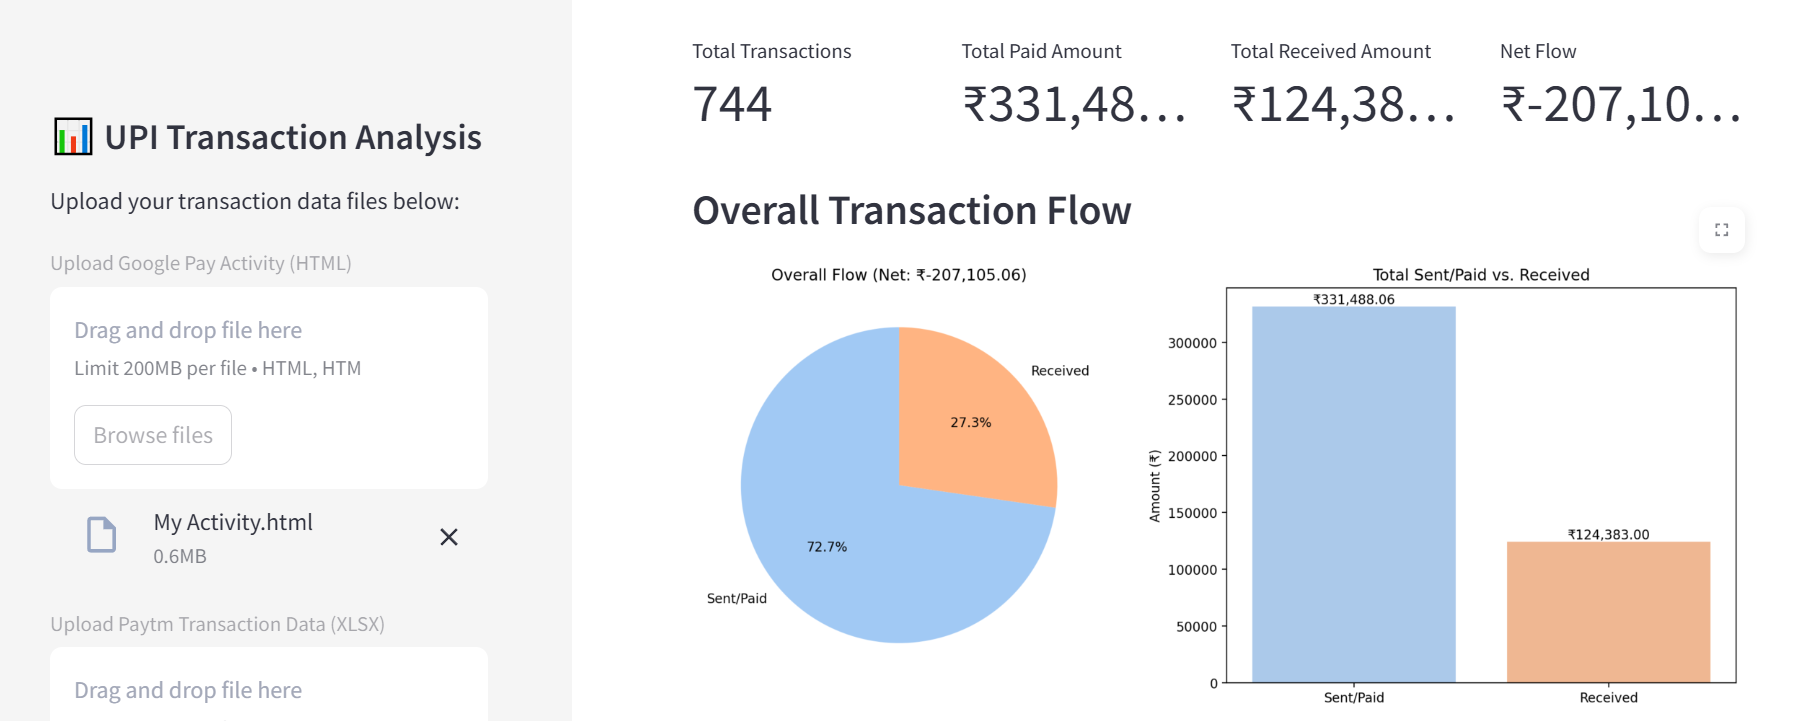
Easily visualize and analyze your Google Pay and Paytm transaction data through insightful graphs and charts — all in one place. This project helps you understand your digital transaction history by converting your raw Google Pay and Paytm data into clear and informative visualizations using Python.
Utilizes Python's BeautifulSoup library to extract transaction data from Google Pay and Paytm HTML files. The script parses the HTML structure to locate and retrieve relevant transaction details such as date, amount, and transaction type.
Processes the raw scraped data to remove duplicates, handle missing values, and standardize formats. For example, dates are converted into a uniform format, and invalid or incomplete entries are filtered out.
Transforms the cleaned data into a structured format using Pandas. This includes creating a DataFrame, categorizing transactions (e.g., income, expense), and calculating summary statistics like total expenditure and income.
Generates insightful visualizations using Matplotlib and Seaborn. Examples include bar charts for monthly expenses, pie charts for category-wise spending, and line graphs for transaction trends over time.
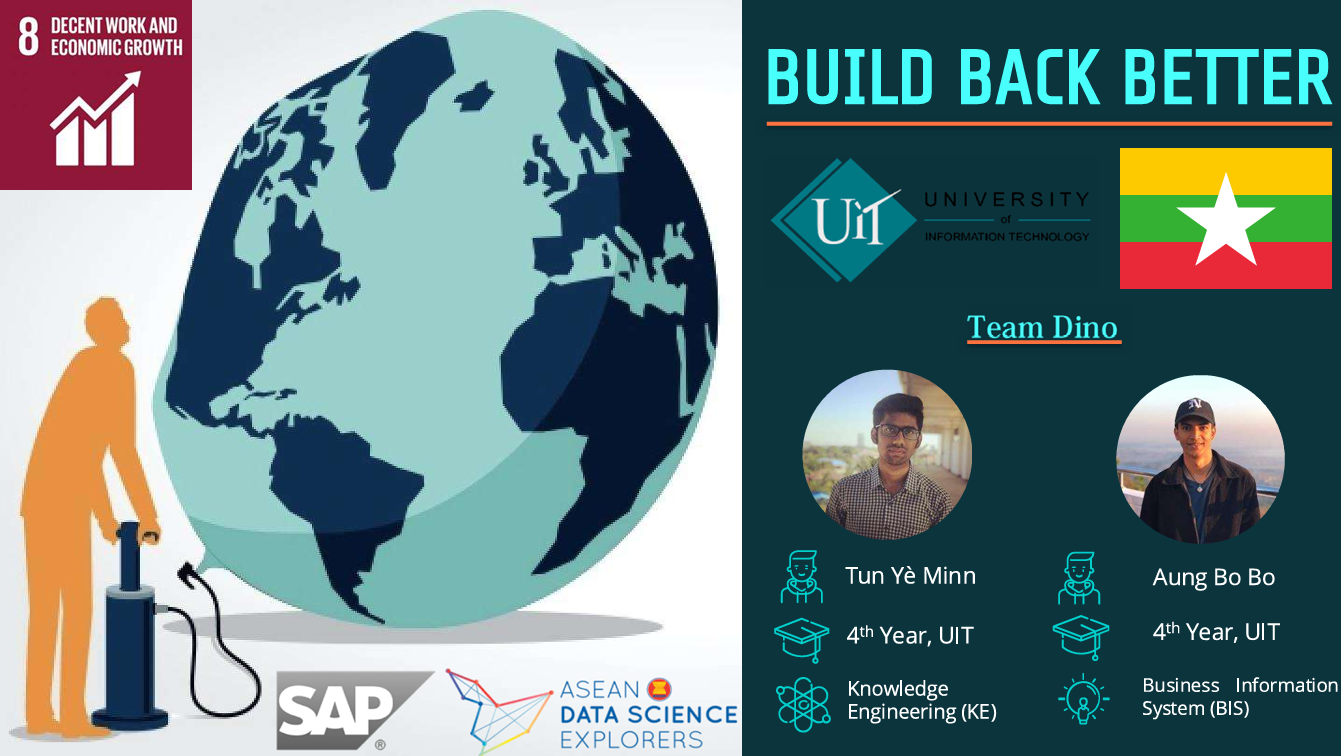
This project was developed as part of the ASEAN Data Science Explorers (ADSE) 2020 competition, an initiative by the ASEAN Foundation and SAP that empowers youth across Southeast Asia to harness the power of data for social impact.
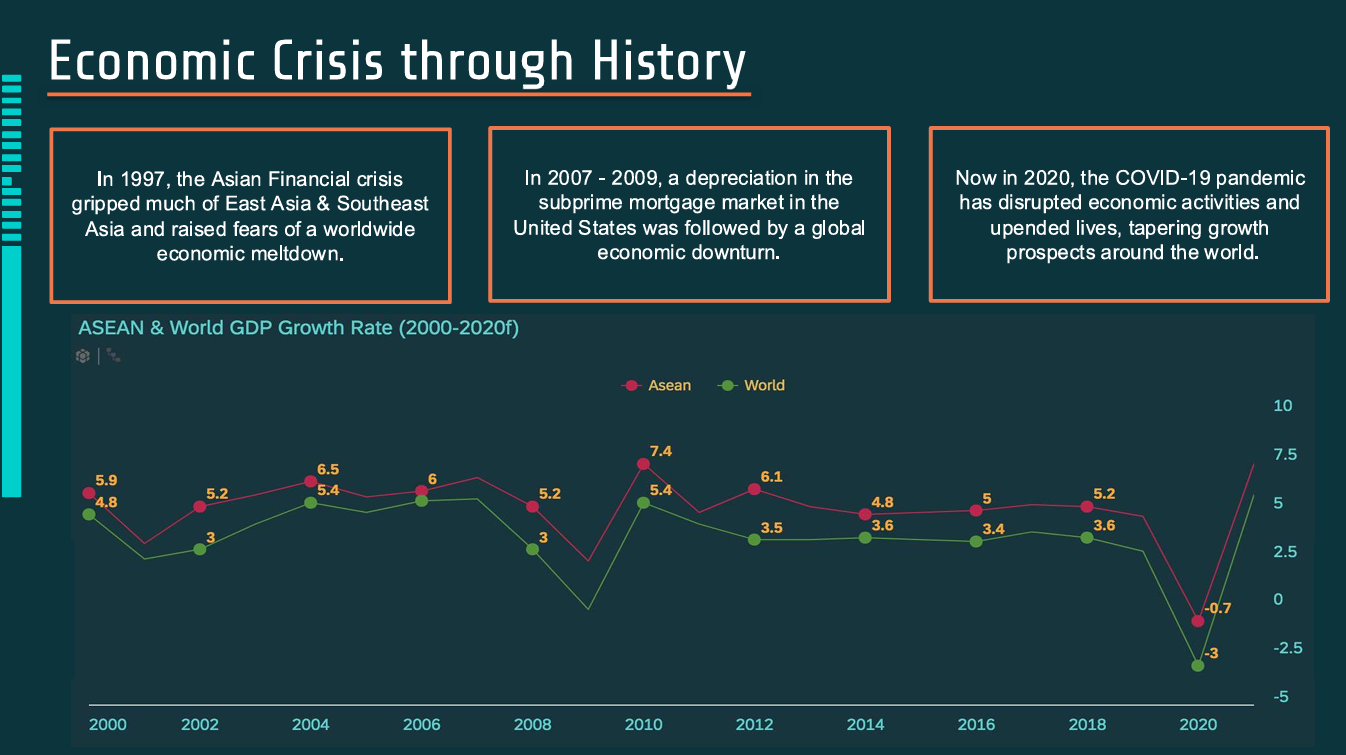
Our project, Build Back Better, was created under the theme of UN Sustainable Development Goal (SDG) 8: Decent Work and Economic Growth. The aim was to address the severe economic challenges faced by ASEAN nations in the wake of the COVID-19 pandemic and propose data-driven solutions to help rebuild and strengthen ASEAN’s economy.
Our project was selected as a Top 10 National Finalist in the ADSE 2020 competition, standing out among numerous entries for its impactful analysis and innovative solutions.
Through this project, we aimed to demonstrate how data science and analytics can drive sustainable recovery and long-term growth in ASEAN economies, while ensuring inclusivity and resilience in the face of future challenges.